See your plant move. Test the plan. Then commit.
Planning software doesn’t have to look like a spreadsheet from 1998. Unbrick shows your shop as it is, lets you try changes on the whole plan before anyone touches the floor, and keeps every number tied to the record behind it.
Your plant, moving
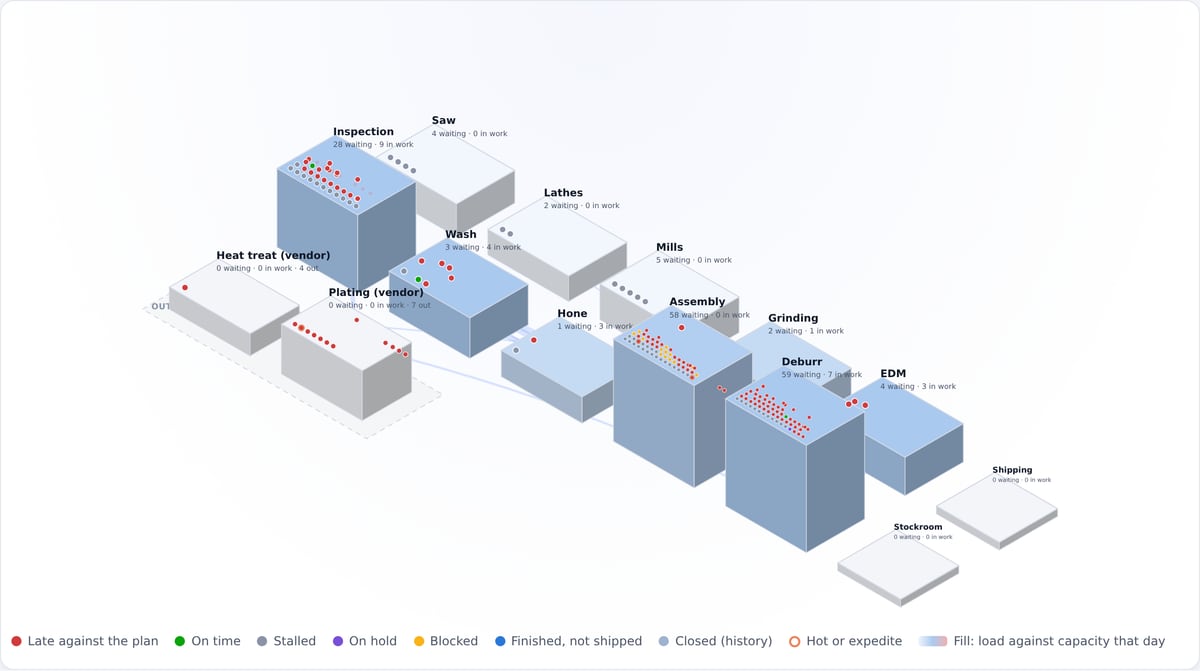
Press play. The last eight weeks replay from your labor records, then the plan carries every lot forward through your departments. Each dot is a lot; click one to open it.
History, then the plan
Where every lot was each day, from labor records, and where the plan takes it next. Scrub to any day, or play it at the speed you like.
Your floor, your layout
The first layout is drawn from your routings. Drag departments over a picture of your floor plan and save it for everyone.
Load you can see
Each department fills from pale to blue to red with that day’s work against its capacity. Click it for the lots there and what runs next.
Two plans, playing in step
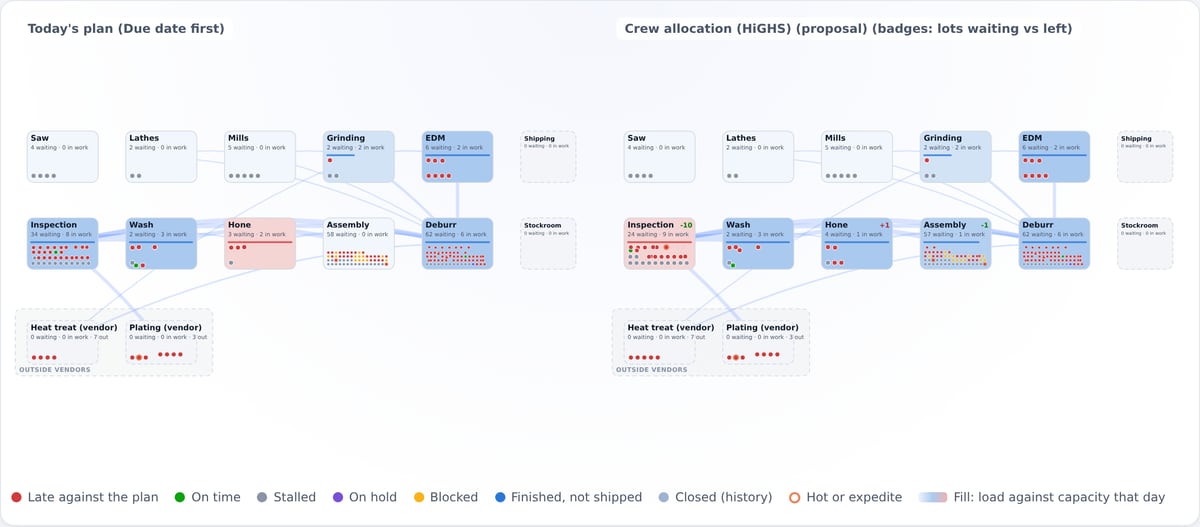
Put today’s plan beside a staffing scenario or an engine’s proposal and play both. Badges on each department show where fewer lots wait. It’s the quickest way to show a plant manager what a change actually does.
- Today’s plan, a saved scenario, or any engine’s proposal
- The same days and the same history on both sides
- Nothing changes until a planner adopts it, with a reason
“Why is this order late?” in one picture
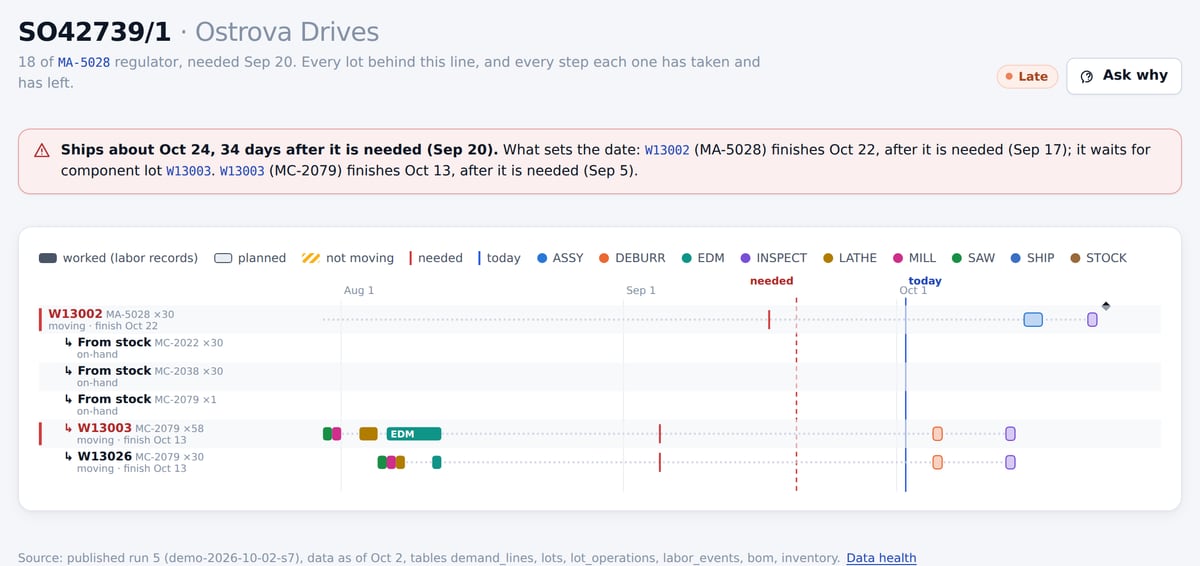
Click any order line. You see every lot behind it, the components and stock that feed those lots, what each one has done and what the plan says comes next. The lots that set the ship date are marked, and the reason is spelled out in plain words.
Then ask. One click opens the assistant with the question filled in. It answers from the same records and cites them.
Solvers that show their work
Start with a rule your planners can predict. Add solvers as the shop grows. Every engine plugs into the same plan, and none of them gets the last word.
Propose
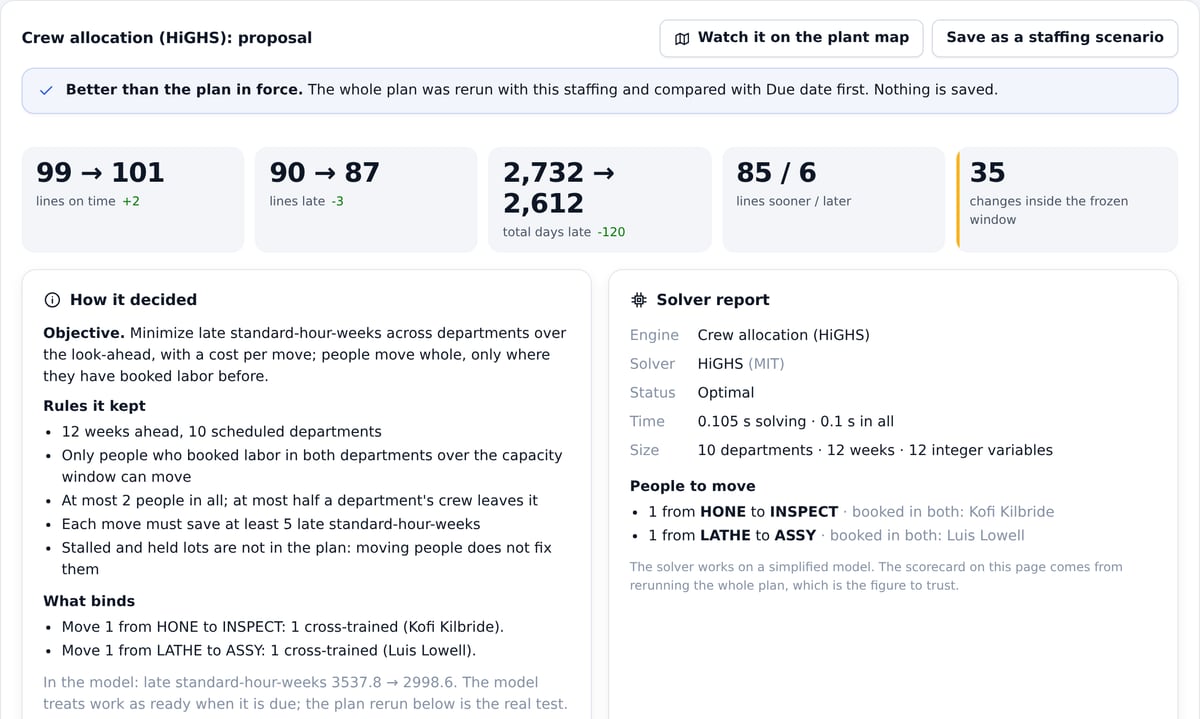
An engine suggests an order of work, or which cross-trained people to move, and says what it aimed for and what limited it.
Rerun the whole plan
The proposal is replayed through the same finite plan as everything else. No solver is taken at its word.
Score it
Order lines on time and late, days late, what moved inside the frozen window, and why each lot moved.
A planner decides
Adopt it with a reason, on record, or don’t. If a solver ever fails, the plan falls back to the simple rule and says so.
From a rule anyone can follow to mixed-integer solvers
The default. Hot, then expedite, then the earliest need date.
A published dispatching rule: what’s at stake per day of work, discounted by slack.
Google OR-Tools CP-SAT orders the work at your top constraint to cut weighted lateness.
HiGHS finds which cross-trained people to move between departments, and for how long.
Open-source solvers (Apache-2.0 and MIT), running on ordinary CPUs inside your deployment. Your data goes to no solver service.
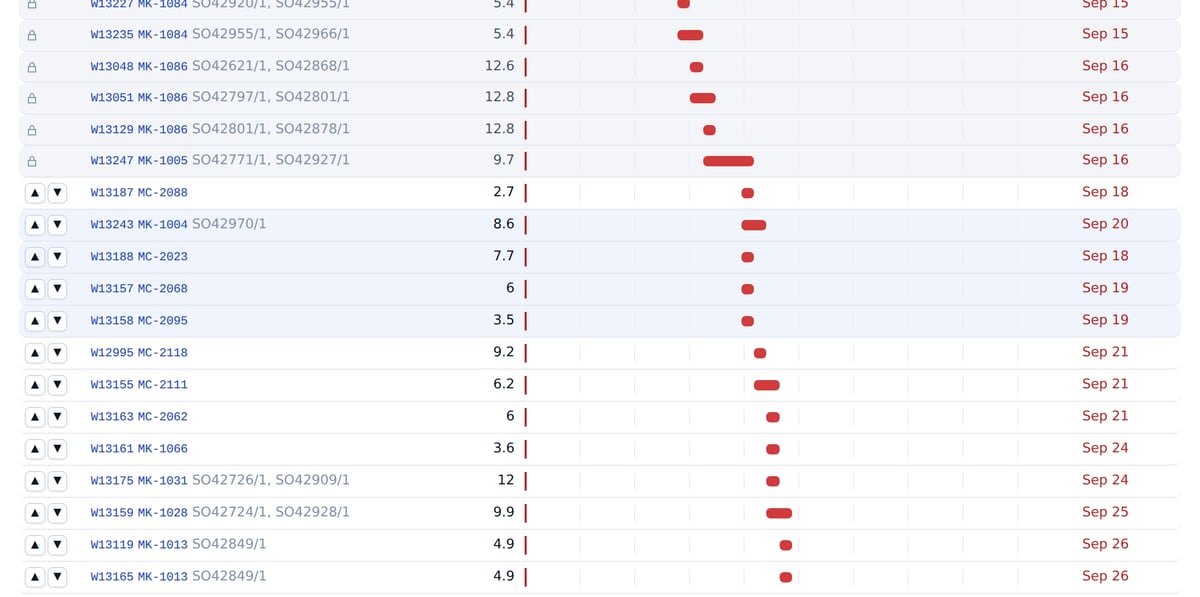
Rearrange the bottleneck, see what it does
The order work runs at one department over the next weeks. Drag lots to try another order. Work inside the frozen window is locked, because the floor is already on it.
Preview reruns the whole plan and shows whose orders gain and whose slip. A planner can make it the order, with a reason.
The rest of the toolkit
Flow
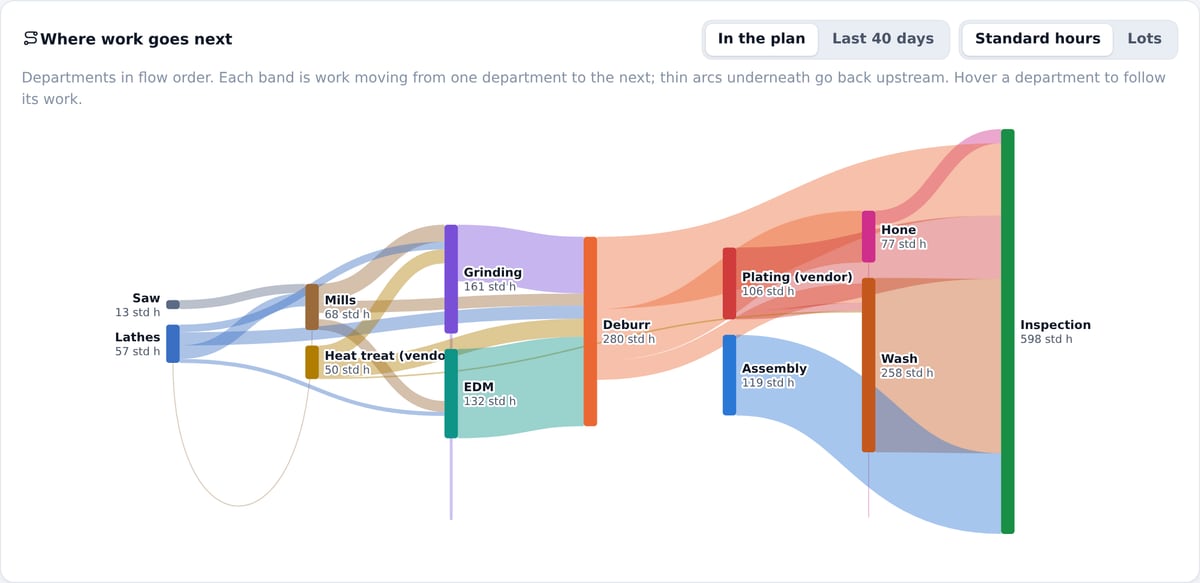
Where work goes next, department by department, in the plan or over recent weeks. The thick bands show where the hours pile up.
Load by week
Every department, every week, against its capacity. Click a week to open the sequence board.
Staffing scenarios
Add people, move them, add a shift or overtime, and see when past due recovers. Capacity splits into people, hours and efficiency, from your labor records.
Throughput
What can ship today, what’s nearly done for late orders, what has stalled, and where one setup could serve several lots.
Planned orders
The new lots it would take to cover demand nothing covers, and “when could we have 50 more?”, answered from what the plan leaves free.
Actions
One list each morning: ship, restart, review a hold, release, move an ERP date. Anything inside the frozen window is marked.
Every dot opens a record
Lots, labor, routings, orders. Nothing on a picture is there for decoration, and nothing is estimated without saying so.
Drawn in your browser
No map, chart or font service is called. It works on the old PC by the shop floor, hosted or on your own server.
Measured on your data
The engine backtest replans from your earlier days and compares deliveries, date error and day-to-day churn. We don’t quote demo results as yours.
A 30-minute demo on the synthetic plant
We play the plant map, follow a late order to its cause, run an engine and adopt it, then show you how the same thing runs on your data in a 30-day pilot.
- WatchYour plant moving: history, then the plan.
- Ask whyOne late order, traced to the lot that sets its date.
- Try a changeA solver proposal, scored on the whole plan.